
You have unlimited access as a PRO member
You are receiving a free preview of 3 lessons
Your free preview as expired - please upgrade to PRO
Contents
Recent Posts

- Object Oriented Programming With TypeScript
- Angular Elements Advanced Techniques
- TypeScript - the Basics
- The Real State of JavaScript 2018
- Cloud Scheduler for Firebase Functions
- Testing Firestore Security Rules With the Emulator
- How to Use Git and Github
- Infinite Virtual Scroll With the Angular CDK
- Build a Group Chat With Firestore
- Async Await Pro Tips
Seven Methods for Debugging Angular Applications
Episode 36 written by Jeff Delaney
Debugging an Angular application can be a major source of frustration, especially when you’re just getting started with the framework. In this lesson, I am going to cover the my top seven methods for Angular debugging, as well a few pointers for Firebase and RxJS specific debugging.
1. Prevent Bugs with TypeScript
The best strategy for debugging is to not introduce bugs in the first place.
TypeScript is your best friend when working with Angular - both for debugging and developer tooling. I prefer to write code with the open-source Atom text editor and its TypeScript plugin. You don’t need to pay for some fancy IDE to take advantage of TypeScript’s enterprise-grade tooling.
When I say take advantage of TypeScript, I am referring mostly to the use of its static typing features. When you do this, you will get instant feedback from your text editor about your code. This will allow you to prevent bugs before they are introduced. Consider the following examples:
Bad: Opting Out of TypeScript
|
In this almost plain JavaScript example, we will not get great feedback from our text editor when something is looking buggy. For example, we could define the animal variable as a string by accident, even though it should always be an animal object
Good: Using TypeScript static typing
export class Animal { |
In this example, we define an Animal class and force variables, arguments, and functions to adhere to the proper data structure. If we tried to define the animal variable as a string, our text editor would tell us exactly why we can’t do this.
2. Using Debugger Statements to Stop JavaScript Execution
It is often helpful to stop the execution of your app at various breakpoints. A debugger statement does just that. In this example, we have an items-list component from the FireStarter Demo app. We can throw in a debugger that will pause our Angular app it it reaches this point. It also provides the code of component (in TypeScript) in chrome dev tools.
In this example, we create two breakpoints that will pause our app. The first one will stop at the constructor and second will stop when the subscription to the animals collection is started.
showSpinner = true; |
Now we can get a play-by-play state of execution of the app for debugging.
3. Inspect Data with the JSON pipe
Sometimes you might retrieve data from an API and know very little about the structure of its response. In these cases, it helps to inspect the data in HTML with the | json pipe. This takes a JavaScript object and converts its it JSON. It can also be used with Firebase observables with the | async pipe, as seen in the example below.
this.animals = this.db.list('/animals') |
<div *ngFor="let animal of animals | async"> |
4. Console Debugging
Angular has a built in debugging tool that allows us to (1) probe an element to get a a debugging context for a component. And (2) run a change detection profile on the app. It works by running a change detection loop and recording the total amount of time required to run single change detection operation in the UI.
probe
To probe a component, open developer tools and highlight the component you want to inspect. Then run the following commend in the Chrome console.
ng.probe($0) |
profiler
First, You will need to enable debugging tools when the app is bootstrapped. In the main.ts file, add the following lines:
import { ApplicationRef } from "@angular/core"; |
Now you can run the following command from the chrome console.
ng.profiler.timeChangeDetection({record: true}) |
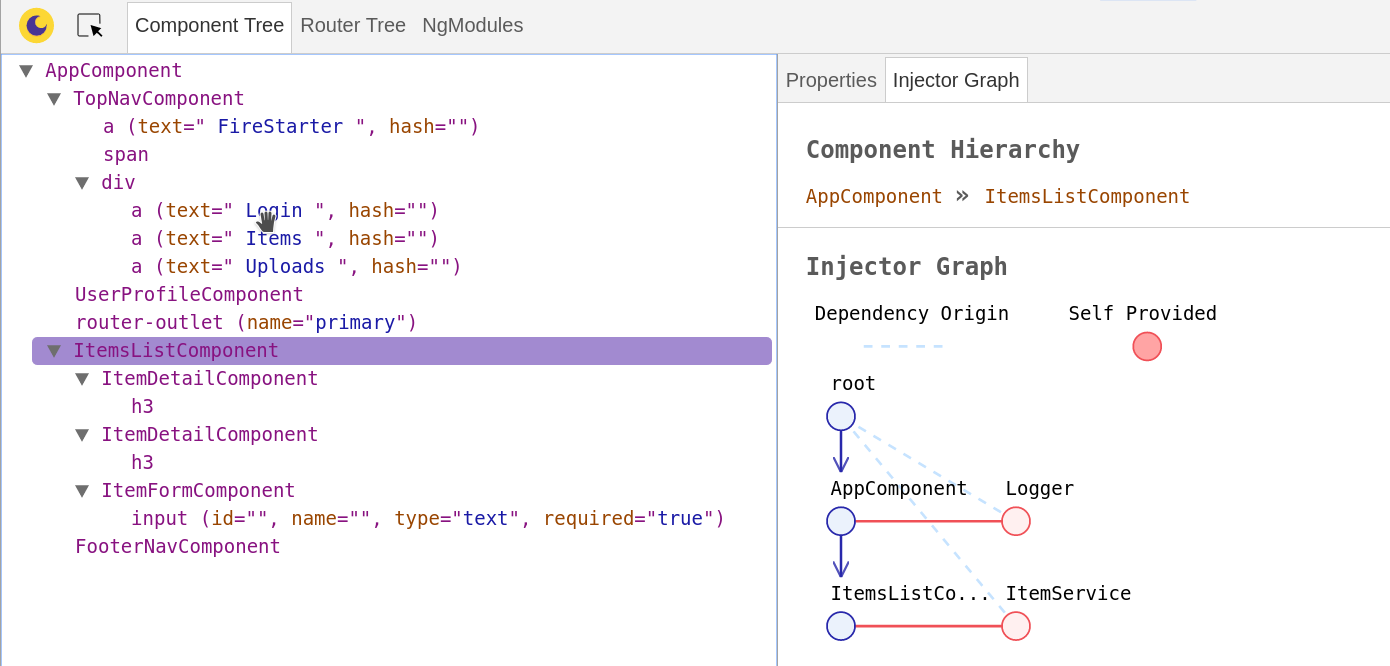
5. Augury Chrome Plugin
Angular apps are structured in a way that can visualized as a hierarchy - that’s exactly what the Augury Chrome plugin achieves. I find it especially useful for debugging issues related to NgModules and routing. The plugin is maintained by the good people over at Rangle.io and it’s a must have for any Angular developer.
6. Angular Logger
As your codebase grows more complex, adding your own custom logger can be a good way to build a custom error . The Angular2-logger allows you to console log messages at different priority levels.
constructor(private logger: Logger) { |
7. Debugging RxJS Observables
I saved the best for last becuase debugging RxJS observables can be tough. You can console log them, but that’s not going to get you very far. The most straightforward way to debug RxJS code is to chain the do operator to the observable flow. The do operator allows you to run arbitrary code at any point to to inspect the results, without affecting the underlying observable. Let’s go ahead debug a Firebase object observable.
this.animal = this.db.object('/animals/hippopotamus') |